Keeping an eye on the weather is something we as sports turf managers have ingrained into our systems. Can I mow today? We check our phones for the most recent forecast. Should I spray today? We monitor dewpoints, humidity and temperatures. Will I need to pull the tarp before today’s game? We study the weather radar. There is a tremendous amount of weather information out there, and nearly all of us have some form of a weather app on our phones or a link to our favorite weather website to help us make day-to-day management decisions. Let’s take a journey to see what products are out there and what information will help us make the best weather-based decisions possible.
Which app is the best?
Honestly, there is no one best app, so it is important to find an app or a number of apps that will provide you the most reliable information that is also easy to find and quickly available. Basic information that is important to have available with the least number of clicks would be high and low temperatures (including overnight lows), dewpoint, relative humidity, and short-term weather forecasts. Intermediate information includes radar (base and composite reflectivity), satellite imagery, and severe weather (especially lightning). Advanced information would be echo tops, vertically integrated liquid, and digital storm accumulation.
Basic information
When looking for basic information, it is best to have all or most all of that data on the first screen of the app. When choosing an app for basic information, you should look for one that has all the data on the first screen or within no more than one or two clicks from the first screen. That is often a good way to judge how well your app will benefit you over time. As an example, the National Weather Service includes much of the basic information. At a glance, you can get a good idea of what is happening now and what will happen in the immediate future. High and low temperatures provide a quick mental image of how the day (and night) may influence your maintenance plans, while winds, dewpoint and relative humidity provide a quick insight on irrigation requirements, disease potential, and infield skin management requirements.
It is beneficial to see both relative humidity and dewpoint together. For example, a relative humidity of 65% with dewpoints more than 70 degrees indicate that less time may be spent watering the infield skin and possibly used to scout for diseases. The same relative humidity with dewpoints under 40 may indicate a majority of the day is dedicated to watering the skin and irrigating.
Intermediate information
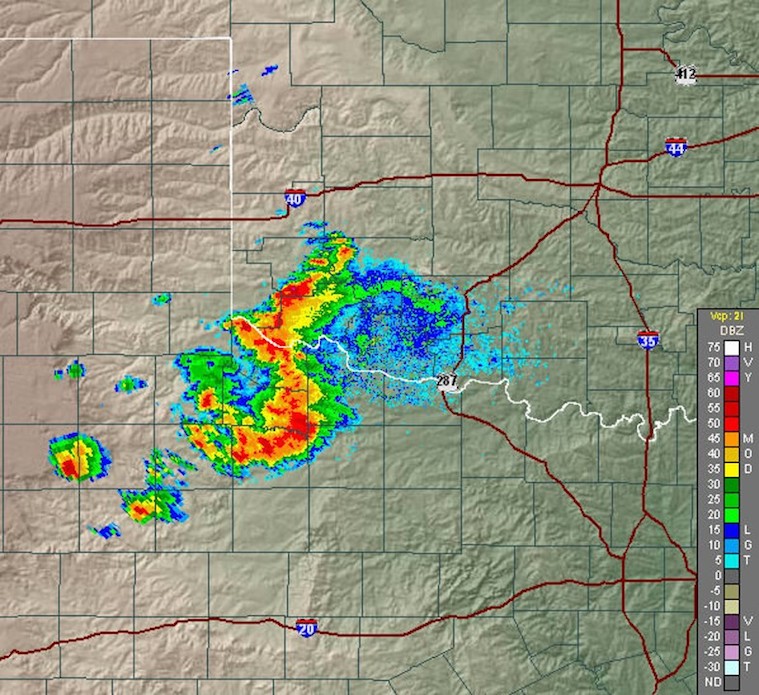
When making game-time decisions such as tarp pulls or field evacuations due to severe weather, radar becomes an important tool. There are a number of good weather radar apps available. Many are free, and some require a fee with costs that hover around $10 or more. Many of the fee-based apps offer expanded functionality, precision and overall quality of information. Regardless of cost, when selecting a radar app, one of the most important characteristics to look for is the type of reflectivity the radar images are based upon. There are two types, base reflectivity and composite reflectivity. Each time a radar transmitter spins, it sends out a microwave “sweep” at different elevations to get a complete picture of all elevations of the atmosphere. A base reflectivity image represents only a single sweep of the radar transmitter. This means that near the transmitter the radar “sees” low in the storms, and as distance increases the beam rises and can overshoot the core of heavier precipitation. Many of the high-resolution (hi-res) radar images are based on base reflectivity sweeps.
Composite reflectivity stitches together all elevation scans in order to create an image that represents a more complete picture of an oncoming storm. These are often lower-resolution images and may be more pixelated.
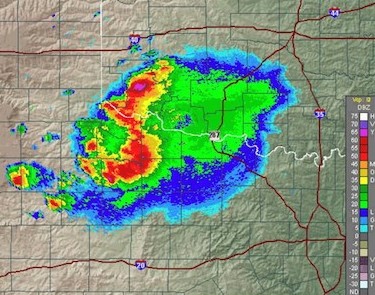
The image at the top and this one are of the same storm, with a base reflectivity image on top and here a composite reflectivity image. Notice the difference in the size and magnitude of the storm. In the upper portion of the composite image a small area (pink in color) containing 16-inch/hour rainfall would have been overlooked if only the base reflectivity image had been used.
For example the RadarScope app has both base and composite reflectivity available, but the SuperRes selection is from one tilt (base reflectivity), and will have good display quality but may not provide a complete picture of the storm.
So, when trying to make critical game-time decisions, a radar image using base reflectivity may significantly underestimate the significance of an oncoming storm. When selecting a radar app, be sure to investigate the types of radar images it provides and be prepared in spending a few dollars for a radar app that will save you time or headaches in the future.
There are numerous satellite imagery options as well. They provide visible cloud cover, infrared (or temperature-based) images of cloud cover (the most common that we see), moisture content, and all-in-one maps that include a combination of radar, infrared, and weather station models to tell a complete weather story. Satellite images can give you a broader perspective of how the weather is behaving on a wider, more continental scale. The images and video loops illustrate airflow, cloud and moisture movement and overall dynamics of frontal systems. These large-scale images and video loops can help in longer-term planning. They can aid in project preparation and can be used as a tool to help protect fields when communicating with administrators who may be considering additional, unexpected events during non-use days. It is useful to compare these images with the common surface weather maps we normally see to get a good working knowledge of fronts and changing weather systems.
Severe weather
Lightning is the most critical facet of severe weather for sport turf managers. In 2009, one in five people struck by lightning were engaged in an outdoor sporting activity. Having an app that can provide you with lightning information instantly or within a click on your phone is important. The lightning information from the WeatherBug app only requires a short scroll down and a single click. An old AM radio is also good to have on-hand as a back up lightning detector. They create a large amount of static when lightning is in the area.
As we work at becoming more proficient with understanding weather and being able to make better weather-based decisions, we need to find more advanced tools to help us. Echo tops or cloud height is another function to help us assess the intensity of an oncoming storm. An echo top measures the overall height of a storm, which is an indicator of the strength of storm updrafts. Stronger updrafts make convective wind gusts and large hail more likely. When several storms are on radar, the Echo Tops tool by RadarScope can point out the more severe storms and the direction they are travelling. This can be valuable information to report to the front office when asked about making a call on a game or whether the conditions will be safe to conduct a last-minute tarp pull.
Another tool to assess the strength of a storm is vertically integrated liquid (VIL). VIL measures how much water is being transported vertically throughout a storm cloud and is another indicator of a storm’s updraft strength. Taller updrafts tend to have higher values of VIL and are more likely to produce hail.
One more tool that can be used to help determine the total accumulation of a precipitation event is digital storm accumulation. By allowing you to assess discrete accumulations over short periods of time, this tool may help you determine whether or not to pull a field cover for a particular rain event, saving time and energy that could be used elsewhere and avoid unnecessary delays. This tool may also aid in determining the potential of a flash flood event in your area.
Today, there are many new tools and information available at our fingertips to help us better plan daily field maintenance, irrigation, disease management and make game-time decisions. For any product that we use, it is important to investigate different apps and functions, ask questions of others using the products, experiment and calibrate any information you use with your specific location and facility. This will help provide us with the most beneficial information possible.
Brad Jakubowski is an instructor of plant sciences at Penn State’s University Park campus.